102 Hail Damage Statistics (November 2026)
Storms by state, insurance claims, roof replacement costs and premiums, each number linked to the organization that produced it.
Hail is the leading weather threat to roofs across much of the United States, and most of it never makes the national news. One storm season can put severe hail on a fifth of the roofs in a state, and the bill shows up later as a claim, a higher premium or a roof that fails years early.
We pulled every number on this page from the organization that produced it: NOAA storm records, state insurance regulators, the U.S. Treasury, insurer claim reports and independent test labs. Each statistic links to its source and carries a date. We refresh the page every month.
Hail damage at a glance
- NOAA logged 7,865 severe hail events in the United States in 2025, counting only hail of 1 inch or larger (NOAA Storm Events Database, Aug 2026).
- Texas recorded 1,302 of those events, about 16.6% of the national total and more than double any other state (NOAA Storm Events Database, Aug 2026).
- State Farm alone paid more than $5.6 billion in hail claims in 2025 (State Farm, Apr 2026).
- Severe storms accounted for 21 of the 23 billion-dollar weather disasters in the U.S. in 2025 (Climate Central, Mar 2026).
- The average residential roof replacement on an insurance claim cost $17,631 in 2025, 33.3% above the 2021 to 2024 average (Verisk, May 2026).
- Sixteen states had severe hail hit 20% or more of their roofs in 2025, up from twelve states in 2024 (Verisk, May 2026).
- Homeowners in the riskiest fifth of ZIP codes paid an average premium of $2,321 from 2018 to 2022, against $1,277 in the safest fifth (U.S. Treasury, Jan 2025).
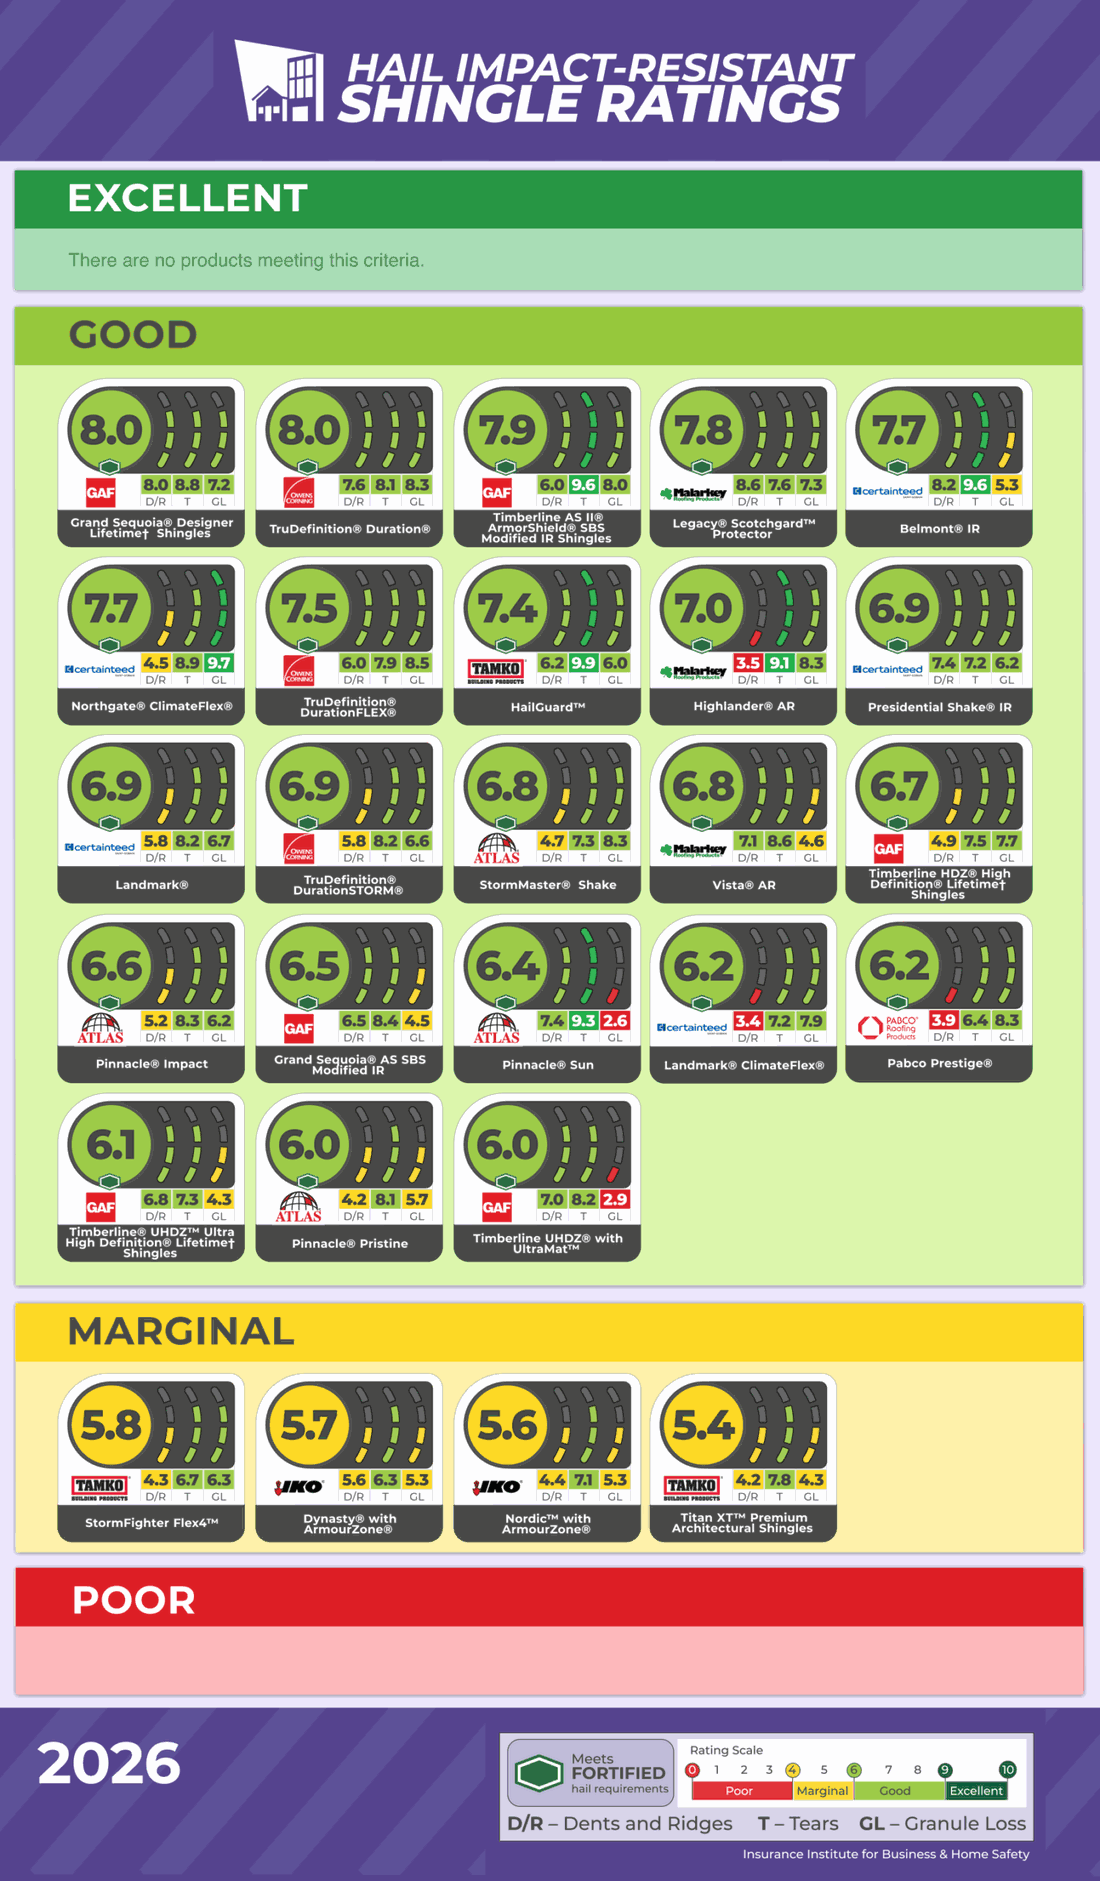
- None of the 27 impact-resistant shingles on the 2026 IBHS scorecard earned the top rating of Excellent (IBHS, Nov 2026).
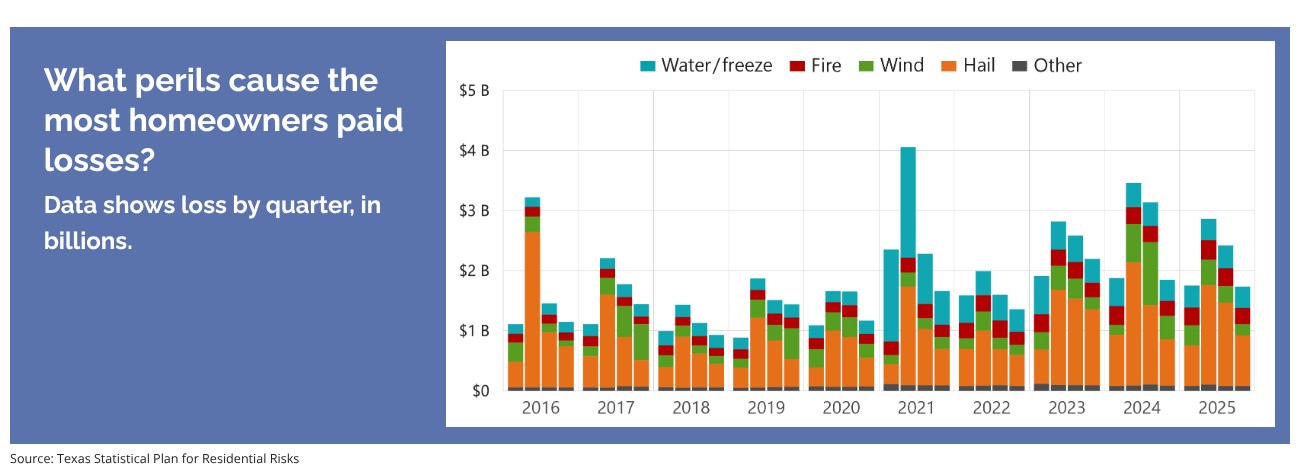
- Hail cost Texas home insurers about $4.93 billion in paid losses in 2024, close to half of all homeowners losses in the state that year (Texas Department of Insurance, Nov 2026).
- The average Texas homeowners premium rose from $1,987 in 2020 to $3,291 in 2024, an increase of about 66% (Texas Department of Insurance, Nov 2026).
- The largest hailstone in NOAA's records for the past ten years measured 7.02 inches and fell in Swisher County, Texas, on June 2, 2024 (NOAA Storm Events Database, Aug 2026).
- 38% of U.S. homes had a roof in moderate to poor condition as of 2025 (Verisk, May 2026).
- Catastrophe events produced 65% of all hail claims in 2024 (LexisNexis, Oct 2025).
Which states get the most hail?
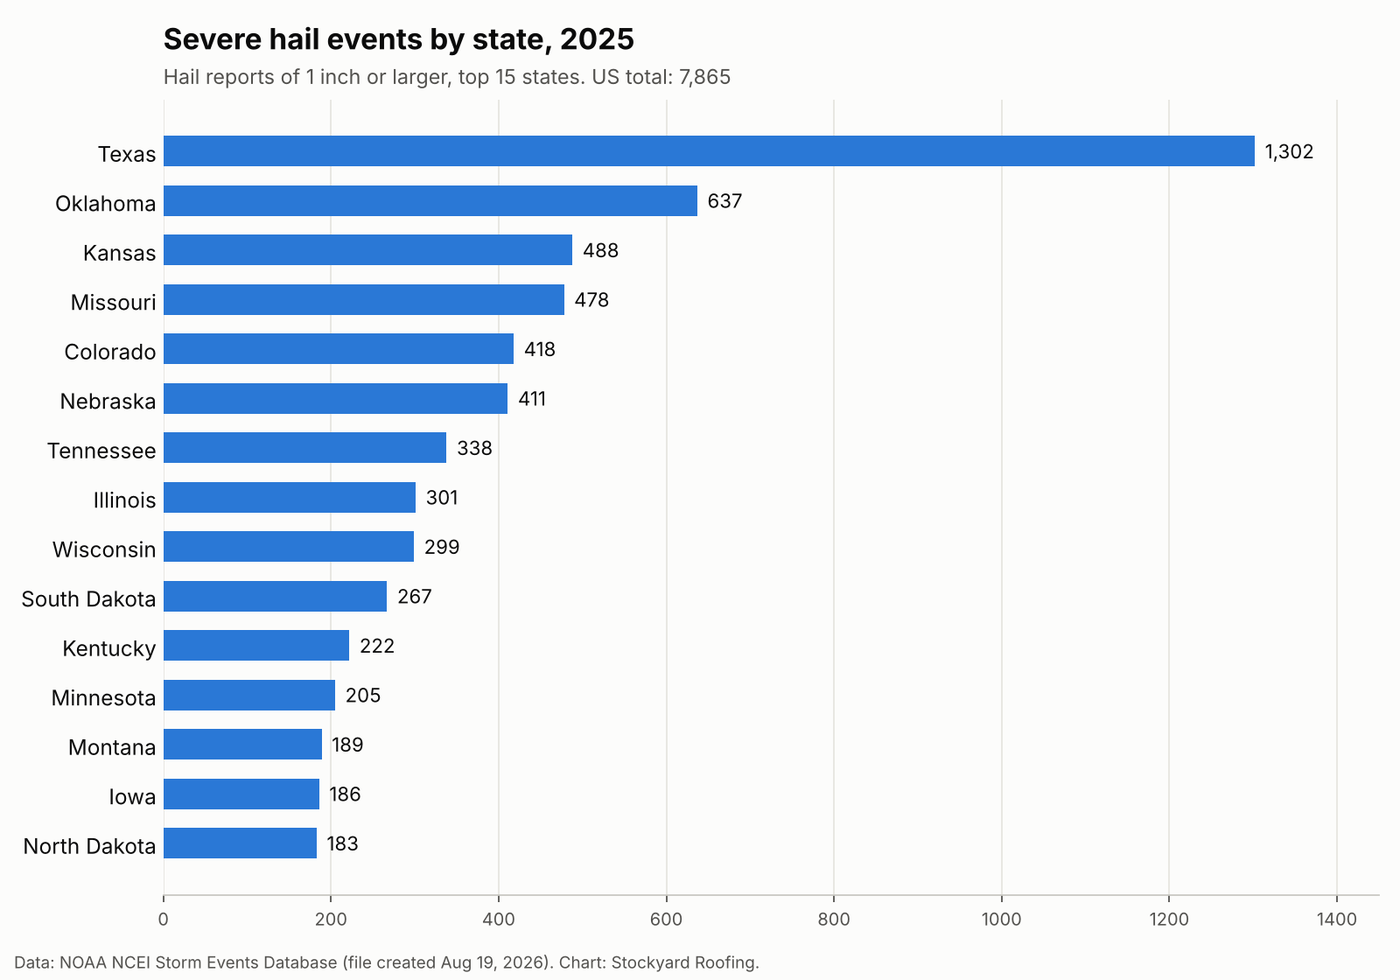
Texas wins every count, and it is not close. The more useful story sits further down the list, where states like Tennessee and Kentucky had years that looked nothing like their own history.
How many hailstorms hit the U.S. each year?
The U.S. averages about 7,100 severe hail events a year, and single years swing far from that average.
- NOAA recorded 70,905 severe hail events from 2016 through 2025, an average of about 7,091 a year (NOAA Storm Events Database, Aug 2026).
- The busiest year of the decade was 2023, with 10,062 severe hail events (NOAA Storm Events Database, Aug 2026).
- The quietest was 2021, with 5,029, half the 2023 count (NOAA Storm Events Database, Aug 2026).
- Counting hail of any size, NOAA logged 9,205 hail events in 2025 (NOAA Storm Events Database, Aug 2026).
Which states had the most hail in 2025?
Oklahoma, Kansas and Missouri followed Texas, each with fewer than half its total.
- Oklahoma recorded 637 severe hail events in 2025, Kansas 488 and Missouri 478 (NOAA Storm Events Database, Aug 2026).
- Colorado had 418 and Nebraska 411 (NOAA Storm Events Database, Aug 2026).
- Tennessee logged 338 severe hail events in 2025, about 27% of everything it recorded in the whole decade (NOAA Storm Events Database, Aug 2026).
- Kentucky's 222 events made 2025 its heaviest hail year of the past ten (NOAA Storm Events Database, Aug 2026).
Which states get the most hail over time?
Over ten years the ranking settles into the Plains, with Texas first in every single year.
- Texas recorded 11,063 severe hail events from 2016 through 2025, about 15.6% of the national total (NOAA Storm Events Database, Aug 2026).
- Kansas ranked second for the decade with 6,054, followed by Nebraska with 4,698 and Oklahoma with 4,379 (NOAA Storm Events Database, Aug 2026).
- Every state recorded at least one severe hail event during the decade, including Hawaii with one and Alaska with five (NOAA Storm Events Database, Aug 2026).
When is hail season?
Hail season peaks in May. In 2025, two of every three severe hail events fell between April and June.
- May 2025 produced 2,449 severe hail events, 31% of the year's total (NOAA Storm Events Database, Aug 2026).
- April, May and June together accounted for 5,176 events in 2025, about 66% of the year (NOAA Storm Events Database, Aug 2026).
How big does hail get?
Most severe hail is between 1 and 2 inches across, and the giant stones are rare.
- 1,046 hail events in 2025 involved stones of 2 inches or larger, about 13% of all severe hail events (NOAA Storm Events Database, Aug 2026).
- The largest hailstone reported in 2025 measured 6 inches and fell in Dickens County, Texas, on May 25 (NOAA Storm Events Database, Aug 2026).
- The largest hailstone on record in the U.S. fell in Vivian, South Dakota: 8 inches across and 1 pound 15 ounces (NOAA NSSL, June 2010).
- Fewer than 0.5% of U.S. residential roofs are struck by hail of 2 inches or larger in an average year (Verisk, May 2026).
What does hail cost nationwide?
Hurricanes get the coverage, but severe storms file the paperwork. Hail and wind events are smaller one at a time, and there are far more of them.
Which states file the most hail claims?
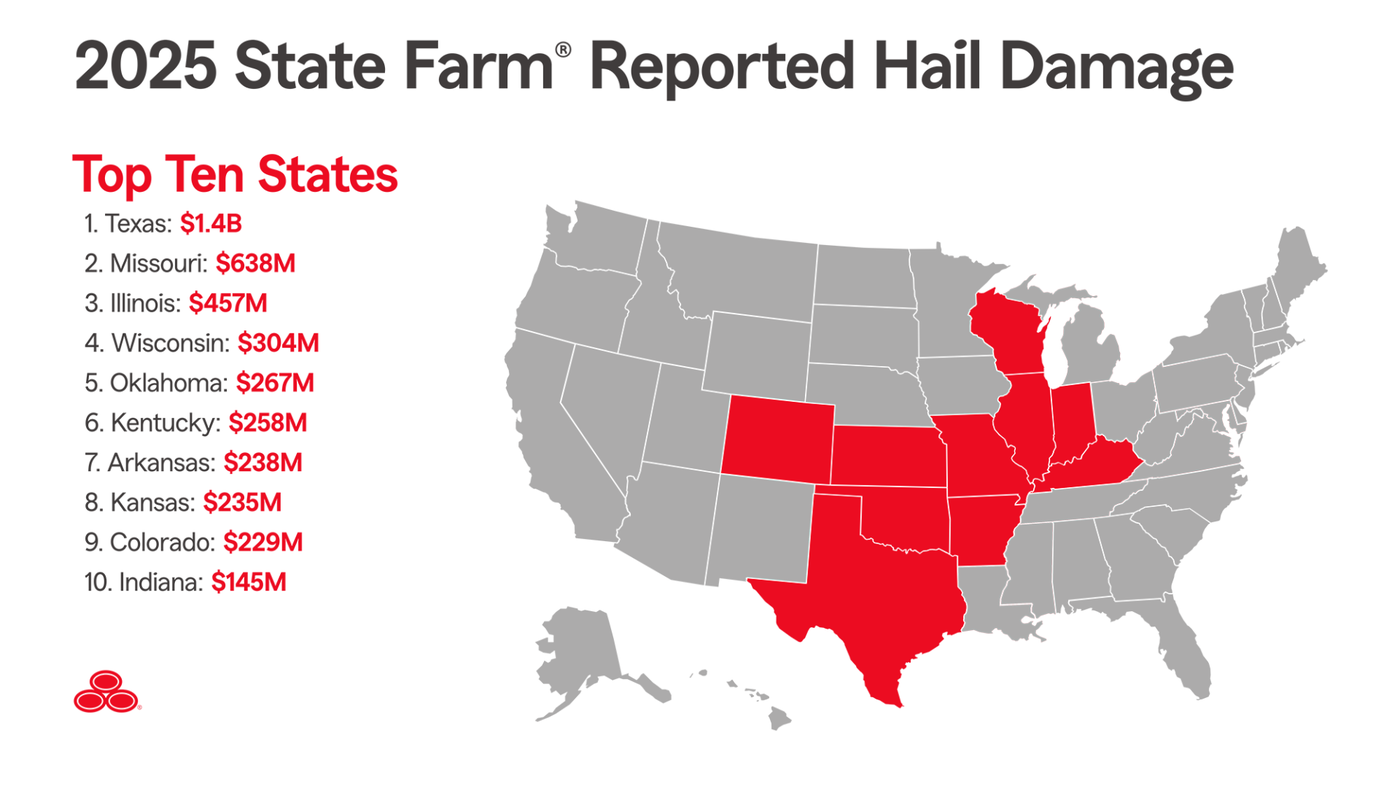
Texas leads by a wide margin. These figures cover State Farm's customers only, so they show the pattern and not the full market.
- State Farm paid $1.4 billion in Texas hail claims in 2025, about a quarter of its national hail total (State Farm, Apr 2026).
- Missouri ranked second at $638 million and Illinois third at $457 million (State Farm, Apr 2026).
- Wisconsin ($304 million), Oklahoma ($267 million) and Kentucky ($258 million) ranked fourth through sixth (State Farm, Apr 2026).
- Arkansas ($238 million), Kansas ($235 million), Colorado ($229 million) and Indiana ($145 million) completed the top ten (State Farm, Apr 2026).
- Storms in March 2026 had already produced more than 50,000 State Farm hail claims in the Midwest by late April (State Farm, Apr 2026).
How often do storms cause a billion-dollar disaster?
Nearly twice a month in recent years, and severe storms are the most common cause.
- The 23 billion-dollar disasters of 2025 cost about $115.0 billion in total (Climate Central, Mar 2026).
- Five of the 23 were severe hail events across the southern and southeastern U.S. (Climate Central, Mar 2026).
- Severe storm disasters cost about $50 billion in 2025 (Climate Central, Mar 2026).
- 2025 was the 15th year in a row with 10 or more billion-dollar disasters (Climate Central, Mar 2026).
- The U.S. averaged 20.2 billion-dollar disasters a year from 2016 to 2025, against 9.2 a year across 1980 to 2025 (Climate Central, Mar 2026).
- Billion-dollar disasters arrived an average of 16 days apart over the past ten years, compared with 82 days apart in the 1980s (Climate Central, Mar 2026).
How do severe storms compare with other disasters?
Severe storms are the most frequent billion-dollar disaster and the cheapest per event, which is why they add up without drawing attention.
- Severe storms account for 224 of the 426 billion-dollar disasters recorded since 1980 (Climate Central, Mar 2026).
- Those storms caused $578 billion in damage from 1980 to 2025, at an average of $2.6 billion per event (Climate Central, Mar 2026).
- Severe storms killed 2,301 people in billion-dollar events from 1980 to 2025 (Climate Central, Mar 2026).
Are hail losses rising?
Hail losses per insured home are trending up even in years with fewer claims.
- Hail loss cost in 2024 ran 19% above the seven-year average (LexisNexis, Oct 2025).
- Hail claim frequency fell 27.8% from 2023 to 2024 (LexisNexis, Oct 2025).
- Nebraska, Colorado, Minnesota, South Dakota and Kansas had the highest hail loss costs from 2018 to 2024 (LexisNexis, Oct 2025).
What does hail do to roofs and replacement costs?
Roof claims dropped in 2025 and the price of each one kept climbing. A homeowner who puts off an inspection after a storm is betting against that trend.
How much does a hail-damaged roof cost to fix?
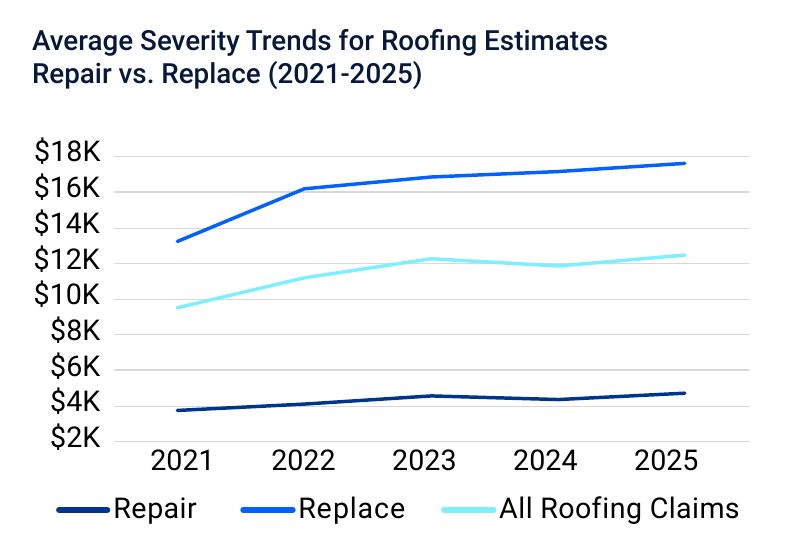
A repair averages under $5,000 and a full replacement runs more than three times that. Verisk's figures come from insurance claim estimates written in its Xactimate software, so they describe insured losses and not every roofing job.
- The average residential roof repair on a claim cost $4,699 in 2025, 25.2% above the 2021 to 2024 average of $4,196 (Verisk, May 2026).
- The average replacement was $15,867 across 2021 to 2024 (Verisk, May 2026).
- Overall claims volume fell nearly 20% in 2025 while roof losses kept rising (Verisk, May 2026).
- Residential roof replacement cost value totaled $23 billion in 2025, against an average of $24.36 billion from 2021 to 2024 (Verisk, May 2026).
- Roofing makes up about 30% of all line items in property claim estimates (Verisk, May 2026).
- Roofing material costs rose 1.48% in 2025 and roofer labor costs rose 0.79% (Verisk, May 2026).
If hail has hit your neighborhood, a free roof inspection will tell you whether you are looking at a repair or a replacement.
How many roofs does hail hit each year?
In the hardest-hit states, about half of all roofs took severe hail in 2025.
- Severe hail reached 51.8% of roofs in Kansas and 47.1% of roofs in Nebraska in 2025 (Verisk, May 2026).
- Oklahoma and South Dakota each had 44.4% of roofs hit, and Arkansas had 41.9% (Verisk, May 2026).
- Over the four years from 2022 to 2025, severe hail reached an average of 49.7% of Oklahoma roofs a year, the highest rate in the country (Verisk, May 2026).
- Nebraska averaged 42.6% over the same four years, Arkansas 37.7% and South Dakota 32.2% (Verisk, May 2026).
- Verisk puts the long-term insured average annual hail loss at $2.2 billion in Kansas, $2.0 billion in Oklahoma and $1.6 billion in Nebraska (Verisk, May 2026).
- Hail claims designated as catastrophe claims made up 33% of all roofing claims in 2025 (Verisk, May 2026).
Does an older roof take more hail damage?
Yes. Worn roofs lose more in the same storm, and hail states replace roofs years sooner than the rest of the country.
- Roofs in moderate to poor condition carry about 60% higher loss costs than roofs rated good or excellent (Verisk, May 2026).
- About 29% of U.S. homes with asphalt shingles have less than four years of useful roof life left (Verisk, May 2026).
- Roofs with less than five years of life left can take 50% more damage in severe weather than roofs with eight or more years left (Verisk, May 2026).
- In hail states, 57% of roofs are nine years old or newer, compared with 38% in other states (Verisk, May 2026).
- Roofs in hail-prone states last an average of 15 years, against 22 years in Nevada, Arizona and Utah (Verisk, May 2026).
What does hail risk do to home insurance premiums?
You pay for your neighborhood's weather whether or not your own roof has ever been hit. Federal data shows the gap between risky and safe ZIP codes, and the terms of roof coverage are tightening on top of it.
Do storm-prone areas pay more for home insurance?
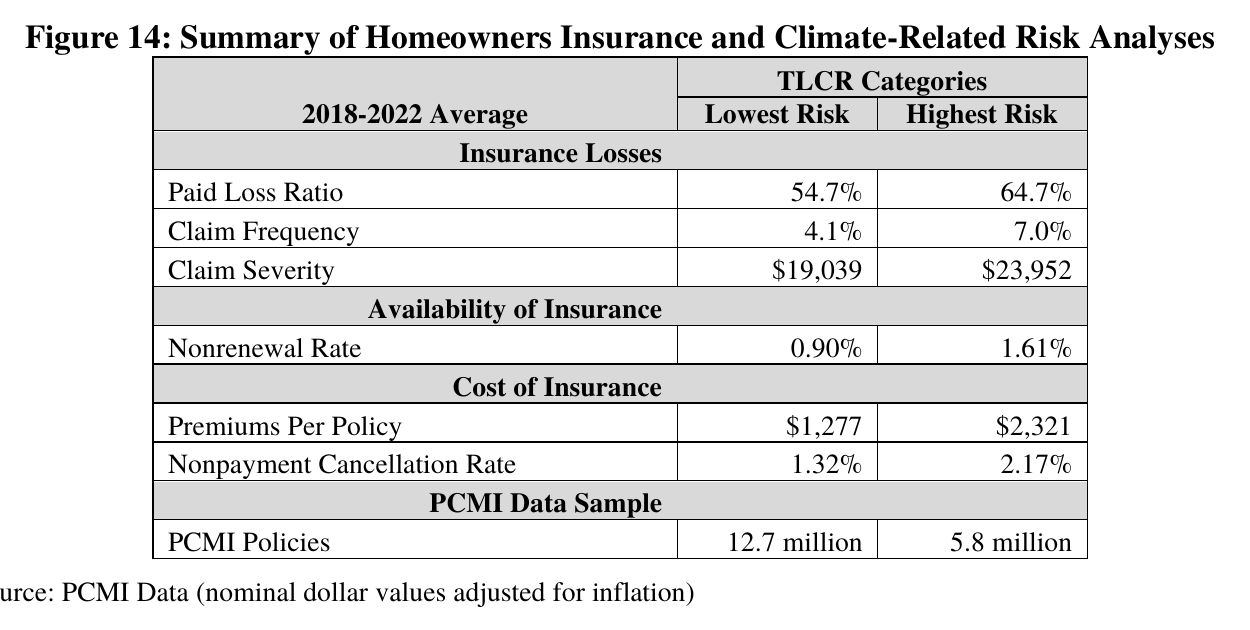
Yes, by 82% on average. Treasury ranked ZIP codes by expected losses from nine weather perils together, hail among them, so this finding covers climate risk as a group.
- Treasury's dataset covers more than 330 insurers and more than 246 million policies from 2018 to 2022 (U.S. Treasury, Jan 2025).
- Average premiums per policy rose 8.7% faster than inflation over those five years (U.S. Treasury, Jan 2025).
- Severe convective storms, the category that includes hail, account for 25.4% of the building value at risk from the perils Treasury studied (U.S. Treasury, Jan 2025).
Do homeowners in risky areas file more claims?
They file more often and each claim costs more.
- 7.0% of policies in the riskiest ZIP codes had a claim in an average year, against 4.1% in the safest (U.S. Treasury, Jan 2025).
- The average claim was $23,952 in the riskiest ZIP codes and $19,039 in the safest (U.S. Treasury, Jan 2025).
- Insurers paid out 64.7% of premiums as claims in the riskiest ZIP codes, compared with 54.7% in the safest (U.S. Treasury, Jan 2025).
Are insurers dropping homeowners in risky areas?
Nonrenewals are still uncommon, but they run much higher where the weather is worse.
- Insurers declined to renew 1.61% of policies a year in the riskiest ZIP codes, against 0.90% in the safest (U.S. Treasury, Jan 2025).
- The national nonrenewal rate reached 1.20% in 2022 (U.S. Treasury, Jan 2025).
- Cancellations for nonpayment ran 2.17% in the riskiest ZIP codes and 1.32% in the safest (U.S. Treasury, Jan 2025).
Is roof coverage getting less generous?
More roof claims now pay the depreciated value of the old roof, which leaves the owner to cover the difference.
- Non-recoverable depreciation applied to nearly 20% of roof claims in 2025, up from 16% in 2021 (Verisk, May 2026).
- Actual cash value and limited settlement terms cover 39% of insured exposure in Illinois, Indiana, Michigan, Ohio and Wisconsin (Verisk, May 2026).
- The same terms cover 22% of exposure across the Midwest, 9% in the South and less than 1% in the West (Verisk, May 2026).
Do impact-resistant roofs hold up to hail?
A label that says impact resistant tells you less than you would hope. Independent lab tests show a wide spread between products that carry the same label.
Do impact-resistant shingles work?
Most perform well in lab hail tests, and a few fall short.
- 23 of the 27 shingles on the 2026 IBHS scorecard rated Good and 4 rated Marginal (IBHS, Nov 2026).
- The highest score on the 2026 scorecard was 8.0 out of 10 (IBHS, Nov 2026).
- The 2025 round tested 24 products that together represent about 95% of impact-resistant shingles sold each year (IBHS, Nov 2025).
- IBHS scores each shingle on dents, tears and granule loss, and it does not recommend Marginal or Poor products in hail-prone areas (IBHS, Nov 2025).
If you are replacing a roof in a hail-prone area, ask about impact-resistant shingles when you price a roof replacement.
Do states pay homeowners to upgrade?
Some do. Oklahoma is the clearest recent case.
- The Strengthen Oklahoma Homes program offers grants of up to $10,000 toward a stronger roof (Oklahoma Insurance Department, June 2026).
- The program has put more than $4 million into 400 roofs since it launched in early 2025 (Oklahoma Insurance Department, June 2026).
- Oklahoma's insurance commissioner says participating homeowners save an average of $720 a year on insurance (Oklahoma Insurance Department, June 2026).
Texas hail statistics
Texas is the hail capital of the country by every measure on this page. For Texas homeowners, hail is the main reason insurance costs what it does.
How much hail does Texas get?
More than any other state in each of the past ten years.
- Texas recorded 1,731 severe hail events in 2023, the most by any state in a single year of the past decade (NOAA Storm Events Database, Aug 2026).
- Texas accounted for 248 of the country's hail events of 2 inches or larger in 2025, about 24% (NOAA Storm Events Database, Aug 2026).
- A 5.9-inch hailstone was reported in Denton County on June 15, 2023 (NOAA Storm Events Database, Aug 2026).
- Large hail of 1 to 2 inches hit 35% of roofs in the Dallas-Fort Worth-Arlington metro area in 2025, down from 50% in 2023 (Verisk, May 2026).
- In 2023, hail of 2 inches or larger hit 78% of roofs in Pecos, 69% in Pampa and 63% in Borger (Verisk, May 2026).
What does hail cost Texas homeowners?
Billions of dollars a year in insured losses, more than wind, fire or water in almost every year.
- Texas insurers paid about $4.85 billion in homeowners hail losses in 2023 (Texas Department of Insurance, Nov 2026).
- Hail losses reached about $4.61 billion in 2016 and have not dropped below $2.1 billion in any full year since (Texas Department of Insurance, Nov 2026).
- Hail was the largest cause of homeowners losses in every year from 2016 to 2024 except 2021, when water and freeze losses reached about $4.75 billion (Texas Department of Insurance, Nov 2026).
- Total Texas homeowners insured losses were $10.3 billion in 2024 and $8.7 billion in 2025 (Texas Department of Insurance, Nov 2026).
If a storm has come through Dallas-Fort Worth, Stockyard Roofing handles storm and hail damage inspections and repairs.
How fast are Texas home insurance premiums rising?
Faster than at any point in the past decade, though the pace slowed in 2025.
- Texas insurers raised homeowners rates by an average of 21.1% in 2023 and 18.7% in 2024 (Texas Department of Insurance, Nov 2026).
- The average rate change slowed to 4.3% in 2025 (Texas Department of Insurance, Nov 2026).
- The preliminary average Texas homeowners premium for 2025 is $3,489 (Texas Department of Insurance, Nov 2026).
- Texas had 8,233,096 active homeowners policies in 2025 and $19.75 billion in direct written premium (Texas Department of Insurance, Nov 2026).
- 157 companies in 81 groups write homeowners insurance in Texas (Texas Department of Insurance, Nov 2026).
What were the worst hailstorms in North Texas?
The 1995 Mayfest storm in Fort Worth still sets the mark.
- The Mayfest storm of May 5, 1995, caused an estimated $2 billion in damage in Tarrant and Dallas counties (National Weather Service, May 1995).
- More than 10,000 people were caught outdoors at the festival and more than 400 were injured (National Weather Service, May 1995).
- The hailstorm of June 13, 2012, cost about $901 million across parts of Dallas, Collin and Fannin counties (National Weather Service, June 2012).
- That storm dropped hail as large as 4.25 inches, the size of a softball (National Weather Service, June 2012).
Can a Texas roofer waive your deductible?
No. Texas law has required homeowners to pay their own deductible on a roof claim since 2019.
- A contractor who waives or absorbs an insurance deductible faces a fine of up to $2,000 and up to six months in jail (Texas Department of Insurance, Aug 2019).
Glossary
- Severe hail: hail 1 inch across or larger.
- Hail event: one hail report in NOAA's Storm Events Database. A single storm can produce many events as it crosses counties.
- Catastrophe claim: a claim tied to a storm the insurance industry has designated a catastrophe.
- Replacement cost value (RCV): the cost to replace a damaged roof with a new one.
- Actual cash value (ACV): replacement cost minus depreciation for the age of the old roof.
- Non-recoverable depreciation: the depreciated part of a claim that the policy will not pay back.
- Severe convective storm: a thunderstorm that can produce hail, strong winds, tornadoes or lightning.
- IBHS: Insurance Institute for Business and Home Safety, a nonprofit lab that tests building materials.
- TDI: Texas Department of Insurance.
Methodology and sources
Every statistic on this page comes from the organization that produced the data, and each one carries the date its source was published or last updated. We do not cite roundups or other statistics pages. The hail event counts are our own tallies from NOAA's Storm Events Database files for 2016 through 2025, counting records with an event type of hail and a size of 1 inch or larger. Other NOAA products count hail differently and will show different totals. State Farm's figures describe one insurer's customers. Verisk's cost figures come from insurance claim estimates. Treasury's findings cover nine weather perils as a group. The Texas Department of Insurance page carries no publication date, so we date it by the month we read it. We update this page monthly and replace any figure whose source has published newer data.
Sources
- NOAA National Centers for Environmental Information, Storm Events Database bulk files
- NOAA National Severe Storms Laboratory, Hail Basics
- State Farm, Paid Over $5.6 Billion in Hail Claims in 2025
- Climate Central, U.S. Billion-Dollar Weather and Climate Disasters in 2025
- Climate Central, full 2025 report (PDF)
- LexisNexis Risk Solutions, 2025 U.S. Home Trends Report
- Verisk, 2026 U.S. Roof Report news release
- Verisk, U.S. Roof Report 2026 (PDF)
- U.S. Treasury, Federal Insurance Office press release
- U.S. Treasury, Analyses of U.S. Homeowners Insurance Markets, 2018-2022 (PDF)
- IBHS, Hail Impact-Resistant Shingle Ratings
- IBHS, 2025 ratings news release
- Oklahoma Insurance Department, June 29, 2026 release
- Texas Department of Insurance, Texas homeowners insurance market overview
- Texas Department of Insurance, New state law cracks down on roof scams
- National Weather Service Fort Worth, Mayfest storm of May 5, 1995
- National Weather Service Fort Worth, hailstorm of June 13, 2012
Hail in your neighborhood?
Get a free roof inspection and a straight answer on what the storm did.
Get a free inspectionor call (817) 241-0859